I was searching the internet for some weather data last week, spring leaf emergence to be exact, and stumbled across a fascinating website, USA National Phenology Network. This organization was established in 2007 and brings together thousands of teachers and students, scientists and citizen observers, and governmental agencies and non-profit groups to monitor and record the impact of climate on plants and animals across the United States.
They have some amazing maps that not only track the progress of spring as it creeps northward. But the one that caught my attention is the Spring Leaf Index Anomaly. This model was constructed using observations of the first leaf and first bloom in a particular lilac variety and two common honeysuckle cultivars. It then measures the difference between emergence in a given year and the 30-year average. The map is updated regularly so you can easily see where spring is ahead of schedule and where it is behind.
This year, as temperatures are warming in the east, spring seems to be arriving early in Tennessee, Kentucky and Virginia. It is a week early in Nashville, TN. On the other side of the country, the cooler temperatures across the west have mostly halted the spread of spring. At least for now.
The term, phenology, refers to key seasonal changes in plants and animals from one year to the next. This timing and relationship of weather and climate to natural events like flowering, emergence of insects and migration of birds helps us answer questions. For instance, perhaps you believe that the Japanese Beetles turned up earlier last summer, making your late application of grubicide less effective than it could have been. Phenology will attach their active cycles to something that you can observe in your own landscape. Now you can apply control measures when they’ll do the most good. After all, I’ve yet to meet a Japanese Beetle or Zimmerman Sawfly larva that followed a calendar.
Aldo Leopold, a hero of mine, kept a phenology diary at his family property in Sand County. It was a family project that recorded bird and animal sightings and bloom times of the native plants. Leopold’s record documents the years from 1935 to 1945. His daughter, Nina, and her family resumed the project in 1976. This data offers the opportunity to study the effects of climate change on a particular location for over 70 years. If you’re a plant geek, how cool is that?
And why is this data important beyond our own backyards? Or even interesting? Because predicting when a species will undergo a phenological transition at a particular has great value for a wide range of short-term natural resource management applications, including scheduling invasive species and pest detection and control activities, planning recreational activities, anticipating allergy outbreaks and planning agricultural harvest dates.
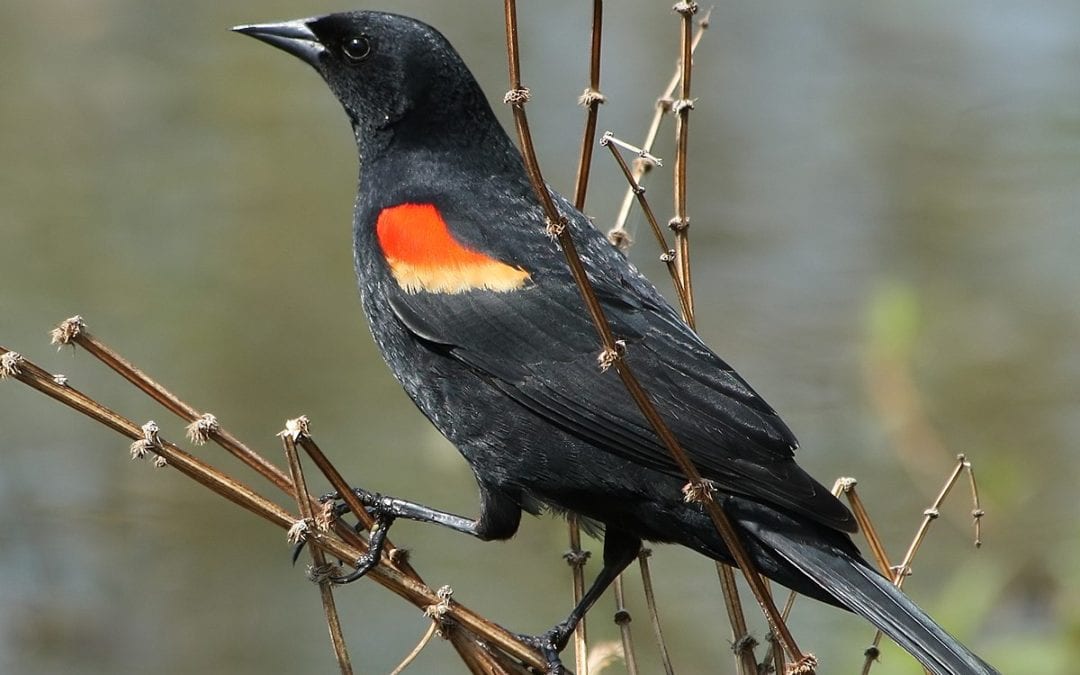
You can gather data about your own piece of our planet. Get a notebook and begin to write down when your hydrangeas bloom. Notate when you see the first red-winged blackbird or the date that the sugar maple across the street begins to show fall color. As years pass, you’ll have a valuable record of the natural life in your yard. And if you’re interested in a bigger picture, take a look at Project BudBurst. This group is building a community of thousands of observers across the country who are sharing their notes. You’ll find them at www.budburst.org. You can also join the Phenology Network’s Nature’s Notebook at www.usanpn.org/natures_notebook. There is also an app available, so that you can record sightings on the go. Together we might put Jimmy out of business.

